How Often You Drive (annual Mileage)
It’s pretty simple math for them: the more miles you cover, the higher the odds you’ll bump into something. Insurers closely examine your annual odometer readings to figure out your total "exposure." If you’re constantly on the road, you’re statistically a higher risk, which usually translates to a steeper premium compared to those low-mileage, weekend-only drivers.

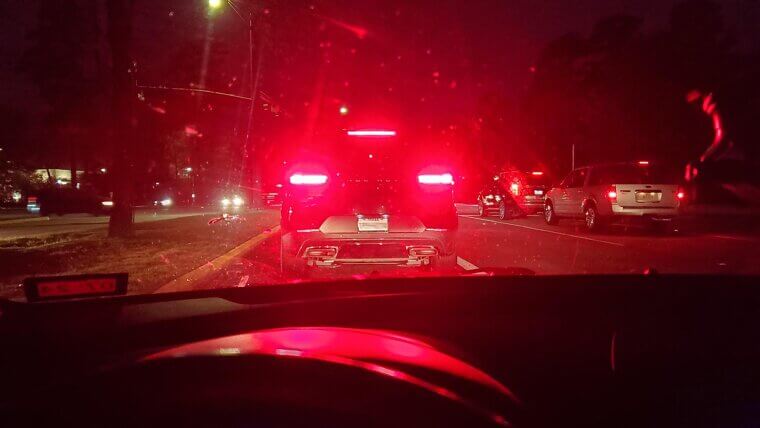
When You Drive (time of Day)
You might love a snack run in the middle of the night, but your insurer isn't a fan. Driving late at night significantly increases your risk score because crash rates spike after dark. Visibility is lower, and other drivers might be tired or impaired, so expect your rates to reflect the "vampire schedule" if you drive at that time.

How Often Do You Exceed the Speed Limit
Your insurer can see every moment your speed creeps past the posted limit. It doesn’t matter if it’s a quick burst or a long stretch; the system flags it. Speeding is one of the most significant predictors of accident risk, so even small patterns matter. If it becomes a habit, your risk score climbs fast.
Think you can hide that heavy foot? Think again.
Think you can hide that heavy foot? Think again.
Harsh Braking, Sharp Cornering, and Hard Acceleration
Smoothness counts more than you think. Those moments where you slam on the brakes, take a corner like a race car driver, or floor the gas pedal are recorded as "harsh events." These jagged driving patterns correlate strongly with risky behavior. Telematics tracks these jolts to build a profile of how aggressive (or defensive) you really are behind the wheel.

Trip Type and Road Class (highway Vs. City/local)
Not all miles are created equal. Your trip logs help insurers distinguish between cruising on open highways versus navigating congested city streets. They weigh these environments differently because stop-and-go urban traffic carries different risks than high-speed interstates.

How Frequently You Accelerate or Brake in Dense Traffic
Telematics can see every tiny speed change you make, especially in stop-and-go traffic. Those micro-adjustments might feel harmless, but insurers notice the pattern. Frequent acceleration and braking in dense areas indicate that a driver is constantly reacting to others, which statistically increases the risk of an accident.
Does the length of your road trips matter?
Does the length of your road trips matter?
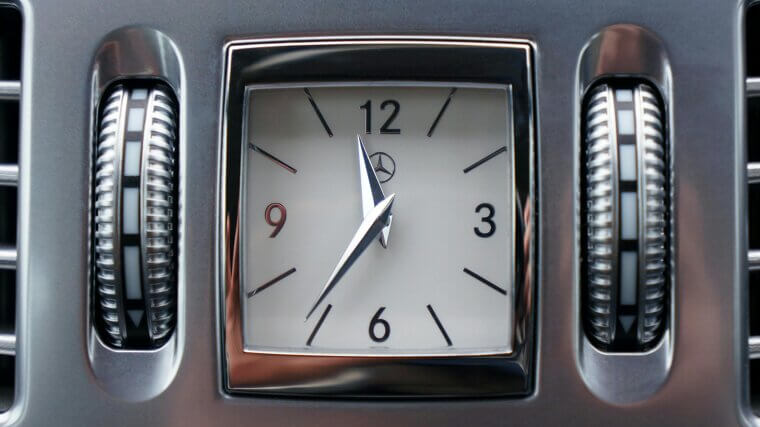
Total Time Spent Driving (trip Duration/driving Episodes)
It isn't just distance; it’s the clock, too. The sheer frequency of your trips and the total minutes you spend behind the wheel feed into usage-based pricing models. Longer episodes of driving increase the likelihood of an incident occurring. Essentially, the more time you spend in the driver's seat, the more "exposure units" you rack up on your policy.
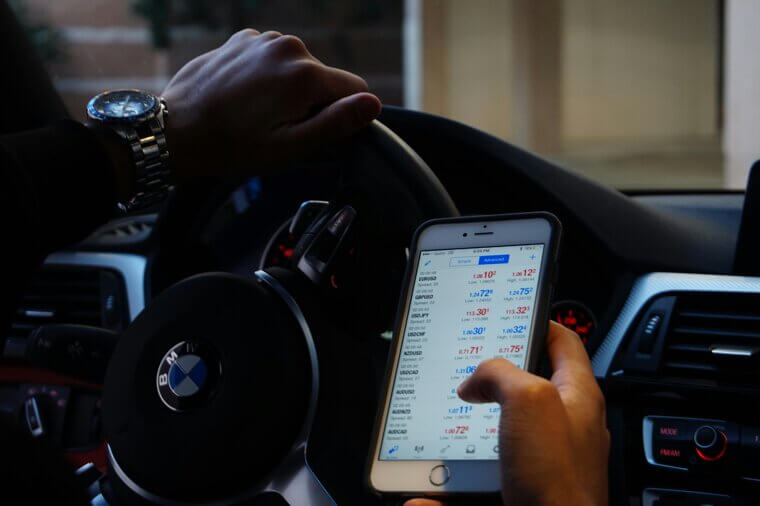
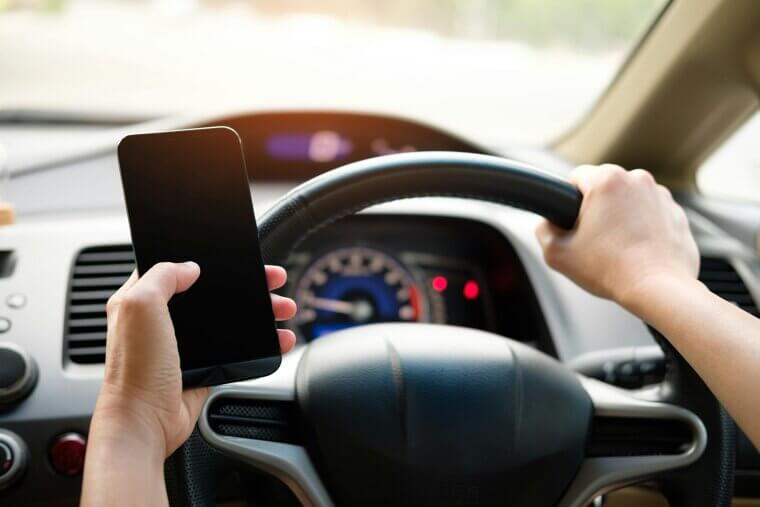
Phone Use / Distracted-Driving Indicators
This one is controversial, but tech is catching up. Certain apps and telematics programs are designed to detect phone movement when the car is in motion. If sensors detect "distracted patterns" like handling your device at 60 mph, it’s a red flag. They want to know if your eyes are on the road or glued to your screen.
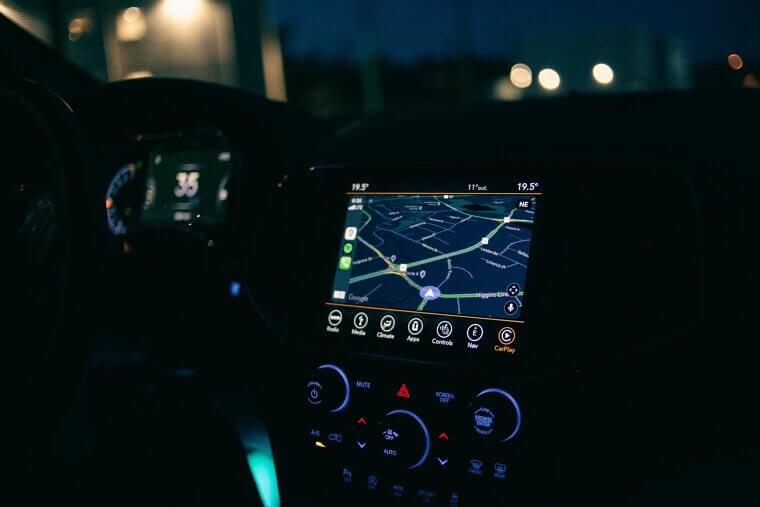
Exact Location and Routes
While privacy concerns are real, connected-car data can technically map your exact routes and parking spots. This highly sensitive information is used in specific analytics to verify where a vehicle actually operates. It’s a hot topic regarding data sales, but for some usage-based programs, they are literally tracing the lines you draw on the map every single day.
If you’ve got a need for speed, you might be in trouble…
If you’ve got a need for speed, you might be in trouble…
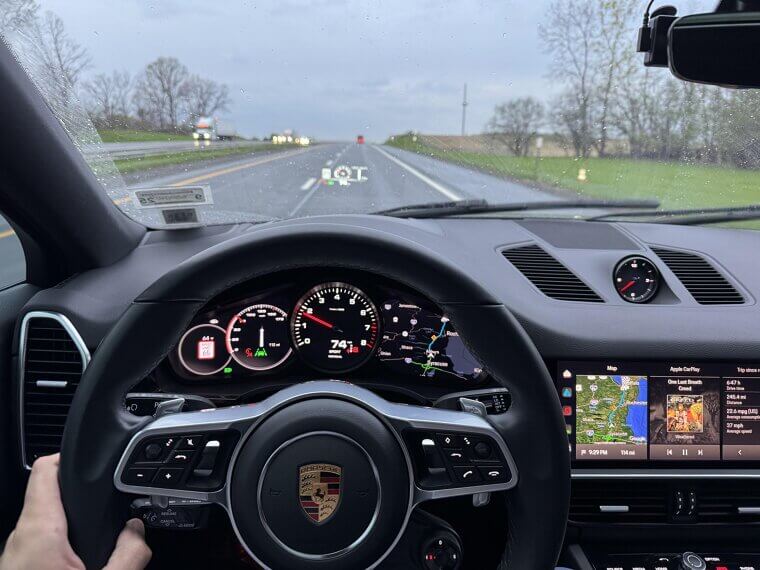
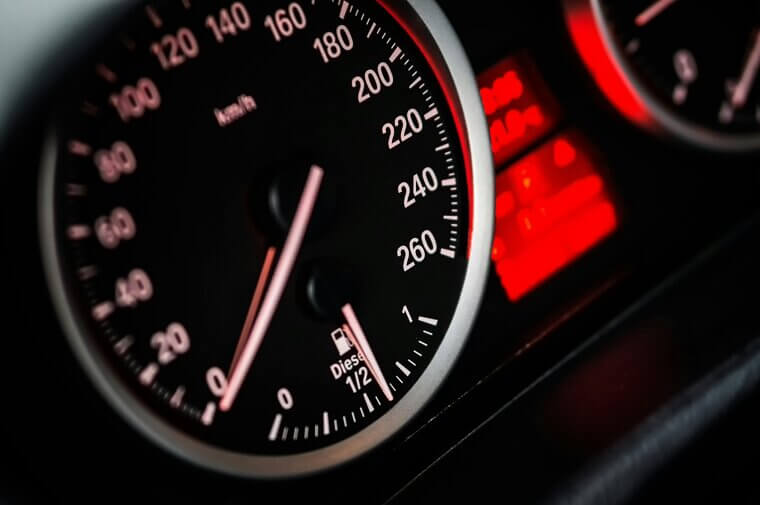
Your Average Speed
Speed is not the only thing that matters! It all comes down to how fast you typically cruise. Some drivers hover a little above the limit without technically “speeding,” and insurers notice. Consistently high average speeds mean less reaction time and a greater chance of severe accidents. Even a few miles per hour above the flow changes your risk category.
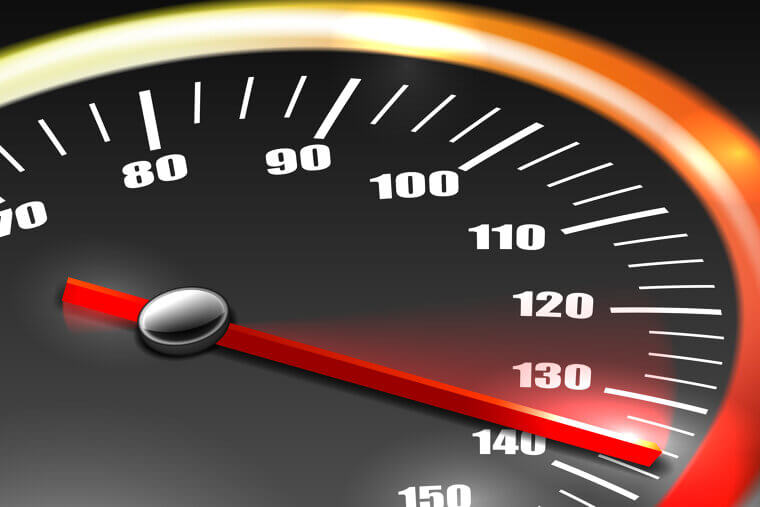
Your Maximum Speed
Every time you hit your highest speed of the day, the system records it. It doesn’t matter if it lasted a second. Your insurer sees the peak. A single spike won’t ruin your rating, but repeated ones show a pattern. And statistically, higher top-end speeds correlate with more severe accidents, which insurers care about deeply.
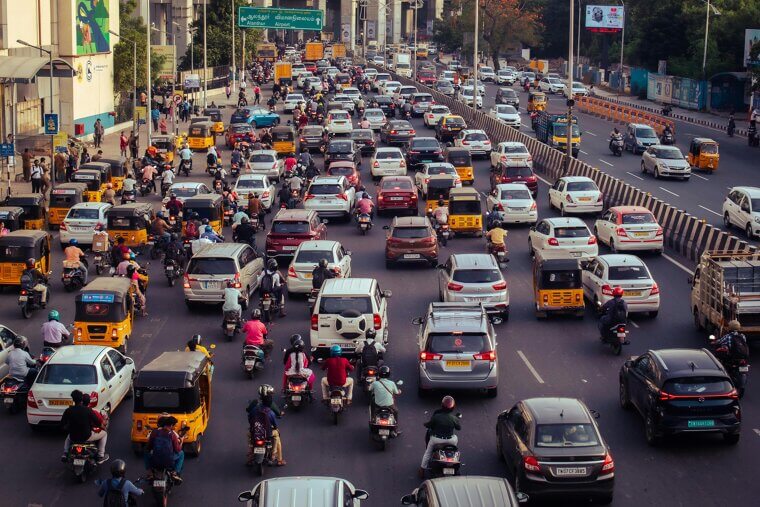
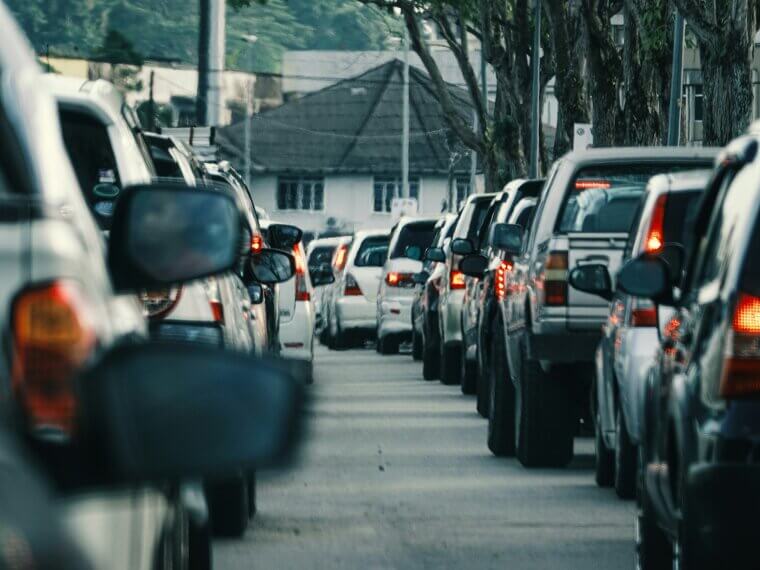
How Often You Drive During Rush Hour
Morning and evening traffic jams aren’t just annoying; they’re statistically hazardous. Stop-and-go driving increases the likelihood of fender benders and side-view mirror scrapes. Your insurer tracks when you're on the road and how often you’re stuck in high-density traffic. The more you’re commuting at peak hours, the higher your exposure to potential accidents.
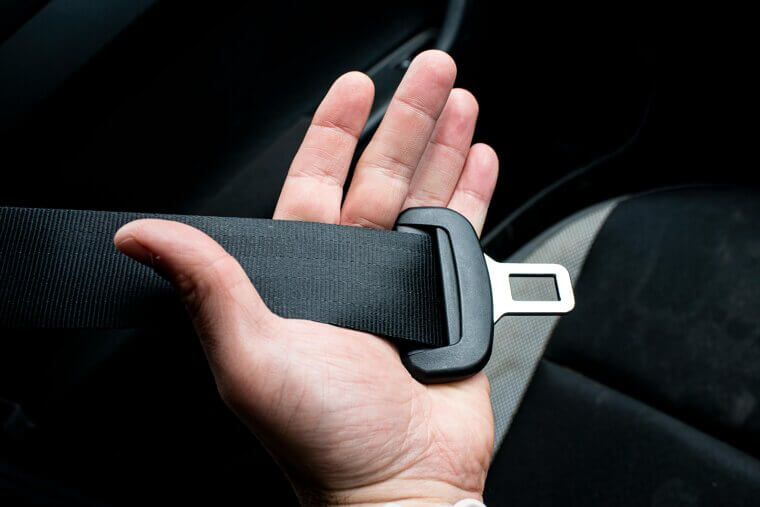
Some cars are now smart enough to know if you're buckled up…
Some cars are now smart enough to know if you're buckled up…

Seatbelt Use
This is the frontier of safety tracking. In certain pilot programs and advanced telematics research, sensors can tell if you (or your passengers) are actually buckled up. Although it is not yet universal, this data point is being incorporated into behavioral scoring. Consistently refusing to wear a seatbelt can paint a picture of a reckless driver, which can negatively impact your safety rating.
Your Reaction Time to Changing Speeds Ahead
Telematics can interpret how quickly you respond when the traffic in front of you slows down. If you’re consistently late to brake, it may suggest distraction or tailgating. Good reaction time means you’re attentive, maintaining distance, and adjusting smoothly.
How Often Do You Idle
Lengthy idle times can reveal heavy traffic, drive-thru visits, or warm-up habits. Insurers don’t care why you idle; they care how often it happens. More idling usually means urban driving, busy roads, and more opportunities for minor accidents. It also hints at your driving environment without saying anything personal about you.
How Frequently You Drive in High-Risk Zones
Your insurer doesn’t know who you’re visiting, but they do know the statistical risk of the roads you travel on. Some areas have higher rates of collisions, theft, or traffic patterns that generate risk. GPS-based risk maps compare your driving routes to known high-risk areas, adjusting your risk score without ever identifying personal destinations.
Do you struggle to stay on track? They know…
Do you struggle to stay on track? They know…
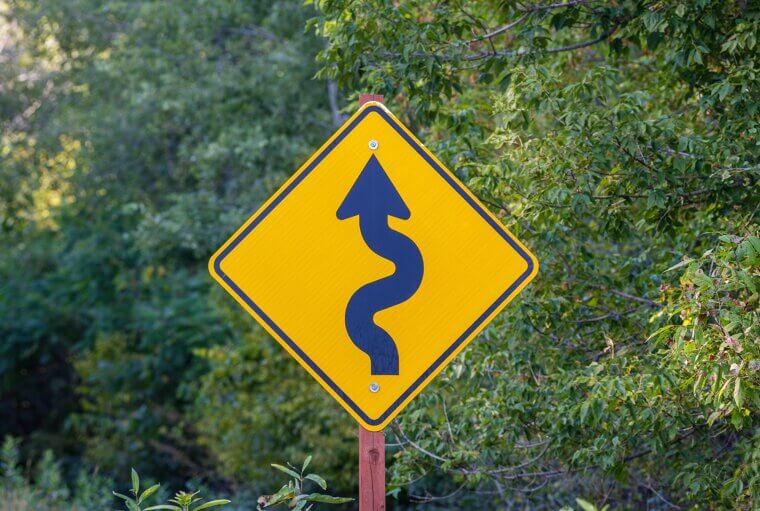
How Consistently You Maintain Your Lane
Your insurer can track small lateral movements while you drive. Consistently drifting within or across lanes hints at distraction, fatigue, or poor attention. Smooth, steady lane-keeping is a hallmark of safer driving, while repeated swaying indicates a higher risk of accidents.
How Quickly You Pick up Speed After Slowing Down
It’s not just how fast you accelerate; it’s how you re-enter traffic after slowing. Telematics measures whether you gradually regain momentum or surge forward aggressively. Rapid restarts suggest impatience or reactive driving, which can increase the likelihood of an accident. Slow, smooth re-acceleration, on the other hand, signals control and awareness.

How Often You Approach Intersections at Higher Speeds
Intersections are hotspots for collisions, and your insurer knows how you handle them. Approaching too quickly rather than slowing early flags risk-prone behavior. One missed early slowdown isn’t catastrophic, but a habit of rolling through intersections at speed paints a picture of a driver who might struggle with split-second reactions.

Your Overall Risk Score
All your driving behaviors, including speed, braking, turning, phone use, nighttime driving, and mileage, blend into an overall risk score. It’s essentially your “driver reputation” inside the insurer’s system. The score isn’t personal; it’s statistical. However, it directly affects premiums, discounts, and the level of trust the insurer places in your day-to-day habits.